注意代码块是tikz而不是latex
\usepackage{circuitikz}

\begin{document}

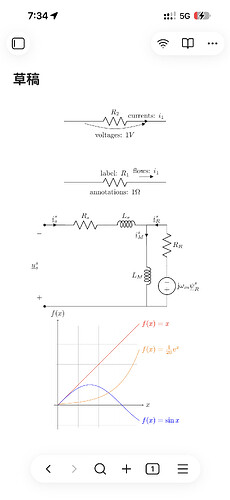
\begin{circuitikz}

\draw (0,0) to[R, l={label: $R_1$}, f={flows: $i_1$}, a={annotations: $1\Omega$}] (5,0);

\draw (0,3) to[R, l=$R_2$, i={currents: $i_1$}, v={voltages: $1V$}] (5,3);

\end{circuitikz}

\end{document}
\usepackage{circuitikz}

\begin{document}

\begin{circuitikz}[american voltages]

\draw

  (0,0) to [short, *-] (6,0)

  to [V, l_=$\mathrm{j}{\omega}_m \underline{\psi}^s_R$] (6,2)

  to [R, l_=$R_R$] (6,4)

  to [short, i_=$\underline{i}^s_R$] (5,4)

  (0,0) to [open, v^>=$\underline{u}^s_s$] (0,4)

  to [short, *- ,i=$\underline{i}^s_s$] (1,4)

  to [R, l=$R_s$] (3,4)

  to [L, l=$L_{\sigma}$] (5,4)

  to [short, i_=$\underline{i}^s_M$] (5,3)

  to [L, l_=$L_M$] (5,0);

\end{circuitikz}

\end{document}
\begin{document}

  \begin{tikzpicture}[domain=0:4]

    \draw[very thin,color=gray] (-0.1,-1.1) grid (3.9,3.9);

    \draw[->] (-0.2,0) -- (4.2,0) node[right] {$x$};

    \draw[->] (0,-1.2) -- (0,4.2) node[above] {$f(x)$};

    \draw[color=red]    plot (\x,\x)             node[right] {$f(x) =x$};

    \draw[color=blue]   plot (\x,{sin(\x r)})    node[right] {$f(x) = \sin x$};

    \draw[color=orange] plot (\x,{0.05*exp(\x)}) node[right] {$f(x) = \frac{1}{20} \mathrm e^x$};

  \end{tikzpicture}

\end{document}


 清音 06-21 20:491楼
 Scaxlibur 06-21 20:492楼
 Alex Fox 06-21 20:533楼
 Nullawiet 06-21 21:004楼
 小鱼 06-21 21:205楼
 Lime123 06-21 21:396楼
 11 06-26 19:257楼